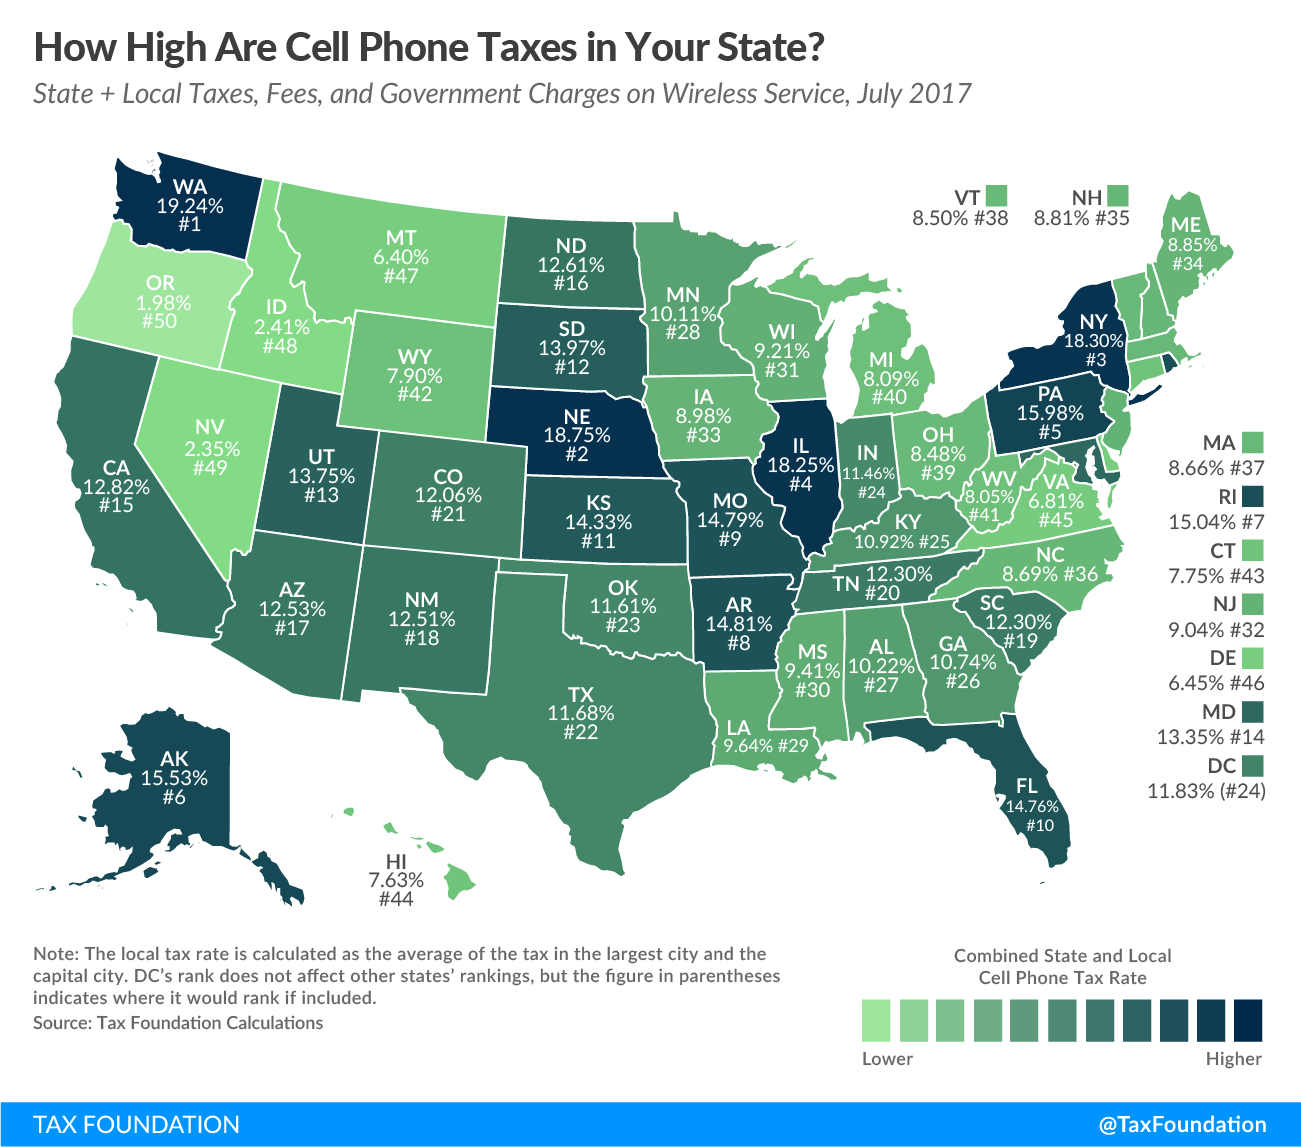
 Figure 2 maps the states by average state-local wireless tax rates, without including the FUSF imposition. Other than the cluster of low tax states in the western United States, there do not appear to be any strong regional patterns to the distribution of high-tax and low-tax states. The New England states tend to have lower wireless tax rates, while the high-tax states are scattered throughout the country.
Figure 2.
There is disparity in tax burdens on wireless as compared to broad-based consumption taxes on other goods and taxable services subject to sales and use taxes. Wireless and other telecommunications are one of the few services that are consistently subject to sales and use taxes by states with both narrow and broad sales tax bases. Table 3 ranks the states by comparing the disparity between the tax rates imposed on wireless service to the combined state and local sales tax rate in each state.Alaska leads all states in this regard, imposing wireless taxes that are nearly nine times higher than average sales tax rates – 15.5 percent versus 1.26 percent. Other states with large disparities include Nebraska (2.7 times), Pennsylvania (2.5 times), Maryland (2.2 times), South Dakota (2.2 times), Florida (2.2 times), New York (2.2 times), Rhode Island (2.2 times), and Illinois (2.1 times).Three states impose lower taxes on wireless service than on other goods and services subject to the sales tax: Nevada, Idaho, and Louisiana.
| Source: Methodology from COST, “50-State Study and Report on Telecommunications Taxation,”May 2005. Updated July 2017 using state statutes, Tax Foundation and FCC data, and local ordinances. | ||||
| State Plus Average Local Sales Tax | State-Local Wireless Tax | Wireless Over / Under Sales Tax | Disparity Multiple | |
|---|---|---|---|---|
| Alaska | 1.76% | 15.53% | 13.77% | 8.82 |
| Nebraska | 6.90% | 18.75% | 11.85% | 2.72 |
| Pennsylvania | 6.34% | 15.98% | 9.64% | 2.52 |
| Maryland | 6.00% | 13.35% | 7.35% | 2.22 |
| South Dakota | 6.40% | 13.97% | 7.57% | 2.18 |
| Florida | 6.80% | 14.76% | 7.96% | 2.17 |
| New York | 8.49% | 18.30% | 9.81% | 2.16 |
| Rhode Island | 7.00% | 15.04% | 8.04% | 2.15 |
| Illinois | 8.69% | 18.25% | 9.56% | 2.10 |
| Washington | 9.20% | 19.24% | 10.04% | 2.09 |
| District of Columbia | 5.75% | 11.83% | 6.08% | 2.06 |
| Utah | 6.77% | 13.75% | 6.98% | 2.03 |
| North Dakota | 6.79% | 12.61% | 5.82% | 1.86 |
| Missouri | 7.97% | 14.79% | 6.82% | 1.86 |
| Kentucky | 6.00% | 10.92% | 4.92% | 1.82 |
| Hawaii | 4.35% | 7.63% | 3.28% | 1.75 |
| Wisconsin | 5.42% | 9.21% | 3.79% | 1.70 |
| South Carolina | 7.37% | 12.30% | 4.93% | 1.67 |
| Kansas | 8.68% | 14.33% | 5.65% | 1.65 |
| New Mexico | 7.63% | 12.51% | 4.88% | 1.64 |
| Indiana | 7.00% | 11.46% | 4.46% | 1.64 |
| Maine | 5.50% | 8.85% | 3.35% | 1.61 |
| Colorado | 7.50% | 12.06% | 4.56% | 1.61 |
| Arkansas | 9.34% | 14.81% | 5.47% | 1.59 |
| US Weighted Average | 7.65% | 12.11% | 4.46% | 1.58 |
| California | 8.48% | 12.82% | 4.34% | 1.51 |
| Arizona | 8.32% | 12.53% | 4.21% | 1.51 |
| Wyoming | 5.26% | 7.90% | 2.64% | 1.50 |
| Georgia | 7.15% | 10.74% | 3.59% | 1.50 |
| Texas | 8.17% | 11.68% | 3.51% | 1.43 |
| Minnesota | 7.29% | 10.11% | 2.82% | 1.39 |
| Massachusetts | 6.25% | 8.66% | 2.41% | 1.39 |
| Vermont | 6.18% | 8.50% | 2.32% | 1.38 |
| Michigan | 6.00% | 8.09% | 2.09% | 1.35 |
| Mississippi | 7.07% | 9.41% | 2.34% | 1.33 |
| Iowa | 6.80% | 8.98% | 2.18% | 1.32 |
| New Jersey | 6.85% | 9.04% | 2.19% | 1.32 |
| Oklahoma | 8.86% | 11.61% | 2.75% | 1.31 |
| Tennessee | 9.45% | 12.30% | 2.85% | 1.30 |
| West Virginia | 6.29% | 8.05% | 1.76% | 1.28 |
| North Carolina | 6.95% | 8.69% | 1.74% | 1.25 |
| Connecticut | 6.35% | 7.75% | 1.40% | 1.22 |
| Virginia | 5.63% | 6.81% | 1.18% | 1.21 |
| Ohio | 7.14% | 8.48% | 1.34% | 1.19 |
| Puerto Rico | 11.50% | 13.58% | 2.08% | 1.18 |
| Alabama | 9.03% | 10.22% | 1.19% | 1.13 |
| Louisiana | 10.02% | 9.64% | -0.38% | 0.96 |
| Idaho | 6.03% | 2.41% | -3.62% | 0.40 |
| Nevada | 8.14% | 2.35% | -5.79% | 0.29 |
| Delaware | 0.00% | 6.45% | 6.45% | NA |
| Montana | 0.00% | 6.40% | 6.40% | NA |
| New Hampshire | 0.00% | 8.81% | 8.81% | NA |
| Oregon | 0.00% | 1.98% | 1.98% | NA |
Total Taxes Paid
In addition to the $5.3 billion in taxes discussed above, wireless consumers also pay an estimated $5.1 billion in FUSF surcharges and $6.7 billion in nondiscriminatory broad-based sales taxes on wireless service. In total, wireless consumers contribute about $17.1 billion in revenues to federal, state, and local governments.
Wireless consumers pay about $5.3 billion in taxes and fees that are specifically levied on telecommunications services but not on other taxable goods and services, consisting of approximately $2.6 billion in 911 taxes and fees and another $2.7 billion in other discriminatory state and local taxes, fees, and government surcharges. According to the FCC, some states and localities routinely divert 911 taxes and fees for other purposes.For example, in July the Illinois Legislature granted the City of Chicago the authority to increase its 911 tax from $3.90 per line to $5.00 per line, effective January 1,2018. Media reports suggest that 911 tax increases were intended to cover a shortfall in city pension obligations.
Appendix C provides a detailed breakdown of the specific taxes, fees, and government surcharges imposed in each state, including the respective rates of each. To facilitate interstate comparisons, local rates imposed in the most populated city and the capital city in each state are averaged into a single rate. In the case of taxes and fees that are imposed on a flat per-line basis – for example, $1 per month per line – the tax is converted from a flat amount to a percentage by dividing the flat amount by the industry average revenue per line of $41.50 per month. For a detailed description of the methodology, please see Appendix A.
Trends In Wireless Taxes And Fees
911 Fees
Most states impose 911 fees to fund capital expenses associated with the 911 system, and in some states fees to fund operations as well. Wireless 911 fees vary greatly by state, from a low of zero in Missouri to a high of $3.34 per line in West Virginia.Most wireless 911 fees are levied at uniform rates statewide, although there are a few exceptions. In Illinois, fees are uniform statewide at $0.87 per line per month except in the City of Chicago, where the fee is over four times higher at$3.90. In July 2017, the legislature overrode the governor’s veto and enacted legislation to increase the state fee to $1.50 per line per month and to allow Chicago to raise the fee to $5.00 per line per month. This is by far the highest wireless 911 fee in the country.
Connecticut, Louisiana, Oklahoma, Utah, and West Virginia also increased 911 fees in 2017. States are under additional pressure to fund upgrades to next-generation 911 (NG 911) programs. Therefore, it is likely that additional 911 tax increases will be debated in state legislatures in the coming years.
State Universal Service Funds
Some states have their own Universal Service Funds (USF) that provide subsidies for many of the same purposes as the FUSF. State USF surcharges are imposed on intrastate revenues, while the FUSF is imposed on interstate revenues. In states like Alaska, Kansas, and Nebraska, high state USF surcharge rates add significantly to the overall burden on wireless consumers.For example, the USF rate in Alaska is 14.2 percent of all intrastate charges. In just two years, significant increases in the state USF rate propelled Alaska upward in the overall wireless tax rankings from 14th highest in 2015 to sixth highest in 2017.
In 2017, state USF rates increased in Alaska, Indiana, Kansas, New Mexico, Utah, and Wisconsin. South Carolina expanded the scope of its USF surcharge to include wireless service. California and Wyoming lowered the rates of their state USF surcharges.
State Level Wireless Taxes
In addition to 911 fees and state USF charges, 14 states impose taxes on wireless service that are either in addition to state sales taxes or in lieu of sales taxes but at a higher rate than the state sales tax. Table 4 below lists these states.No states increased or decreased discriminatory state wireless taxes in 2017.
| State Gross Receipts Tax in Addition to Sales Tax |
Higher State Tax Rate in Lieu of Sales Tax |
Wireless Tax but No State Sales Tax |
|---|---|---|
| Indiana | District of Columbia | Delaware |
| Kentucky | Florida | Montana |
| New York | Illinois | New Hampshire |
| North Dakota | Maine | |
| Pennsylvania | ||
| Rhode Island | ||
| South Dakota |
Local Wireless Taxes
Many local governments also impose discriminatory taxes on wireless consumers. Many of these are legacy taxes that were established during the regulated telephone monopoly era that existed prior to the late 1980s. Local governments in some states have longstanding authority to impose “right-of-way” fees on telephone companies for placing poles, wires, and other landline infrastructure on public property. In other states, localities exercised the authority to impose franchise fees on telephone companies in exchange for granting one company the exclusive franchise agreement to provide service within the municipality.
In the late 1990s and early 2000s, when wireless service began to displace landline service, localities became concerned about losing revenues and sought to extend these legacy fees to wireless providers even though wireless providers did not receive the same benefits for which the fees were established. For example, a wireless provider does not receive the ability to access the public right of way to place equipment. Instead, wireless providers negotiate a rental agreement for the use of public property similar to agreements negotiated with private property owners. In addition, wireless providers must pay billions to purchase spectrum from the federal government through auctions held by the Federal Communications Commission(FCC).
Local governments in 12 states currently impose some type of tax or fee on wireless service over and above any broad-based local sales tax. In most of these states, the local wireless tax is in addition to state taxes. California is the exception; wireless service is not subject to sales taxes but is subject to local Utility User Taxes at rates as high as 11 percent.Table 5 provides a breakdown of the types of local wireless taxes.
